
 Cost Study Needed to Determine True Cost of Educating and Supporting Students Economically Disadvantaged in Ohio
November 29, 2021
By Alison Paxson, Communications & Policy Associate
All Ohio children deserve equitable, high-quality educations that foster opportunities for bright and thriving futures.
However, not all Ohio students have access to opportunities to unlock their full potential, and this is disproportionately the reality for Black and brown students and for students who are living in poverty, disabled, experiencing homelessness, LGBTQIA+, in foster care, learning English as a second language, returning from juvenile detention, and others who have historically experienced marginalization. For many of these students, wide disparities in access to health care, nutrition, technology, stable housing, economic stability, and other basic needs persist, limiting their “whole child” wellbeing and therefore, their preparedness to learn.
Many also have experienced the added stressors of COVID-19 that have further impacted their learning and their ability to access needed educational supports and other school-based services throughout the pandemic. New data from the 2020-2021 school year makes these impacts abundantly clear – particularly for BIPOC students and for those experiencing economic distress.
In a press release issued last month, Children’s Defense Fund-Ohio called attention to this new Ohio Report Card Data and the wide disparities it reveals in key educational indicators for students who are Black, Latinx, Indigenous, and other students of color:
- High School Graduation. The statewide 4-year graduation rate has risen since the class of 2016, from 83.6% to 87.2% for the class of 2020. This is true across all demographics; however, disparities in 4-year graduation rates persist. For example, 90.1% of white students graduated in four years in 2020 compared to just 76.9% of Black students, 78.8% of Latinx students, and 79.8% of Indigenous students.
- Chronic Absenteeism. In 2020-21, the percentage of students who were chronically absent increased to 24%, compared to 17% in 2018-19. Among Black students, chronic absenteeism increased slightly over 50%, from 31% to 47% from 2018-19 to 2020-21 (meaning that nearly 1 in 2 Black students missed more than 10% of instruction time during the past school year). Among Latinx students, chronic absenteeism increased 64% and among white students it increased 35%.
- 3rd Grade Reading Proficiency. Proficiency in English Language Arts declined across the board for Ohio’s 3rd graders. In 2020-21 fewer 3rd grade students were proficient in reading compared to the 2018-19 school year, decreasing from 66.7% to 51.9% in two years. Among Black and Latinx students, the decline was closer to 30% and 20% respectively within this same time period. The 2019-2020 school year had the lowest rates of proficiency, with only 44.2% of 3rd graders scoring proficient test results.
- 8th Grade Mathematics Proficiency. Fewer 8th graders were proficient in math in 2020-21 compared to 2018-19, decreasing from 57.3% to 42.6%. During the 2020-2021 school year, a mere 15.4% of Black students scored at least proficient on standardized testing in math compared to 51.2% of white students.
In a new analysis, CDF-Ohio finds that wide gaps in educational well-being are also revealed when viewing the data through the lens of poverty and economic disadvantage. While this may be unsurprising, especially given the K-shaped recovery of the pandemic, the data is no less striking and stark in contrast to students whose families have greater access to living wages and higher levels of economic security. According to the data:
- High School Graduation.In the 2020-2021 school year, 78.4% % of students economically disadvantaged were graduating on time, which is 11.2% percentage points lower than the state average of 87.2% for all students.
- Chronic Absenteeism. Chronic absenteeism rates are also higher for students economically disadvantaged – in fact, 3 times higher than for students who are not considered economic disadvantaged. In 2020-2021, 37.5% of students economically disadvantaged were chronically absent compared to 11% of their peers not considered economically disadvantaged.
- 3rdGrade Reading Proficiency. Academic proficiency indicators have also seen drops among students whose households have less wealth and lower incomes. The state average for 3rd grade reading proficiency stands at 51.9%; however, for students economically disadvantaged the rate of proficiency is nearly 20 percentage points lower at 35.4%.
- 8thGrade Mathematics Proficiency. Of 8th graders in Ohio who are proficient in math, almost 28,000 fewer students who are economically disadvantaged are achieving this standard.
Unfortunately, where a child is born, lives, and grows plays a significant role in what resources and educational opportunities are accessible to them and their families. Even prior to the pandemic, less than half of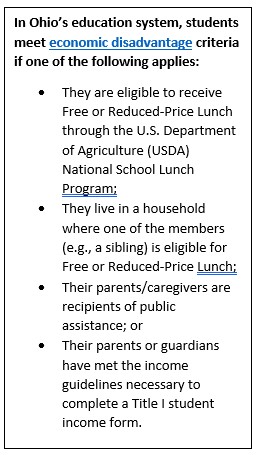 American children born into household and neighborhood poverty were kindergarten-ready compared to 78% of their wealthier peers in 2019. Living in poverty impacts a child’s access to early learning opportunities and other necessities such as stable housing and food, and when compounded over time without significant intervention and support can be devastating for the child and their community.
The fact is that many of our communities and schools are deeply divided by both race and economic status, and this perpetuates gaps in opportunity. According to the Children’s Defense Fund’s annual report, The State of America’s Children 2021, only 1 in 8 white students attends a school where the majority of students are Black, Latinx, Asian, or Indigenous, whereas nearly 7 in 10 Black children attend such schools. Indeed, nearly 1 in 5 students attend schools where most of their peers are both living in poverty and Black or Latinx. This segregation by race and economic wealth has long-lasting and wide-ranging consequences, especially as these divisions can often determine the quality of a child’s school and educational experiences (e.g., pupil-to-teacher ratios and overcrowded classrooms, etc.). In many states like Ohio, large disparities in school funding have meant more under-funded schools in low wealth areas for generations of students, particularly for students experiencing poverty and students who are BIPOC, or both.
Ohio’s new Fair School Funding Plan formula, enacted for the next two years in the state’s biennial budget, shows promise in addressing these disparities in funding caused by an overreliance on local property taxes that benefitted wealthier communities. With this new funding structure, analyses show that funding will primarily rise in districts in some areas of Appalachia and specifically in districts with high concentrations of Black, Latinx, and other students of color by 3.7% over the next two years (compared with 1.7% in districts with the least concentrations of students of color). While enacting this new formula is an important step forward for greater equity for Ohio’s students, we know that to see its true promise it needs to be fully funded and phased in permanently.
Part of the legislation also required that a study be conducted to examine and make recommendations for the economic disadvantage component of the formula. This is needed to ensure equity in how we fund the educations of children in our state. National research has shown that students experiencing economic disadvantage typically require 30% more funding to educate than their peers who are non-disadvantaged. Why are additional funds necessary? Children who are lacking in their basic needs being met consistently focus much of their energy on survival. When a child is not supported in their basic needs, their bodies and minds are not prepared nor ready for classroom learning, and additional resources are needed to support their readiness.
The Fair School Funding Plan includes provisions to address these additional needs; however, some additional work is needed to ensure that it is adequate. The Plan increases the economically disadvantaged student aid (now referred to as “disadvantaged pupil impact aid”) base amount from $272 to $422 per pupil. However, the fact remains that the $272 number is an arbitrary figure in the first place and there is no real basis for what that number represents. Many have determined that in the absence of an actual study conducted to determine the true cost of educating students who qualify as economic disadvantage, this part of the formula and the plan remains incomplete.
Without a formal study, and the necessary resources allocated to fill in gaps that emerge, school-aged children experiencing economic disadvantage will continue to be denied the equitable K-12 experiences they deserve. Data from the 2020-2021 school year paints a clear picture of the challenges faced by students most marginalized from educational opportunity in our state, but it is true that we need more data still, as well as long-term sustainable investments driven by those findings dedicated accordingly, to ensure we are addressing these issues and doing right by each child in Ohio.